Tutorial 2: Spectral Line Imaging#
This script was written for CASA 6.6.4.34
Source: First Look at Line Imaging (CASA Guide)
https://casaguides.nrao.edu/index.php/First_Look_at_Line_Imaging_CASA_6.5.4
Adapted for ALMA Data Processing Workshop @ University of Victoria
J. Speedie (jspeedie@uvic.ca) October 2024
Dataset: TW Hya self-calibrated N2H+ line+cont measurement set (435 MB)
twhya_selfcal.ms.tar (Download)
Your working directory should look like:
TUTORIAL2 >> ls
script_spectral_line_imaging.py
twhya_selfcal.ms.tar
Untar with:
tar -xvzf twhya_selfcal.ms.tar
Getting oriented with the data#
listobs(vis='twhya_selfcal.ms',
        listfile='twhya_selfcal_listobs.txt')
Prepare to subtract the continuum#
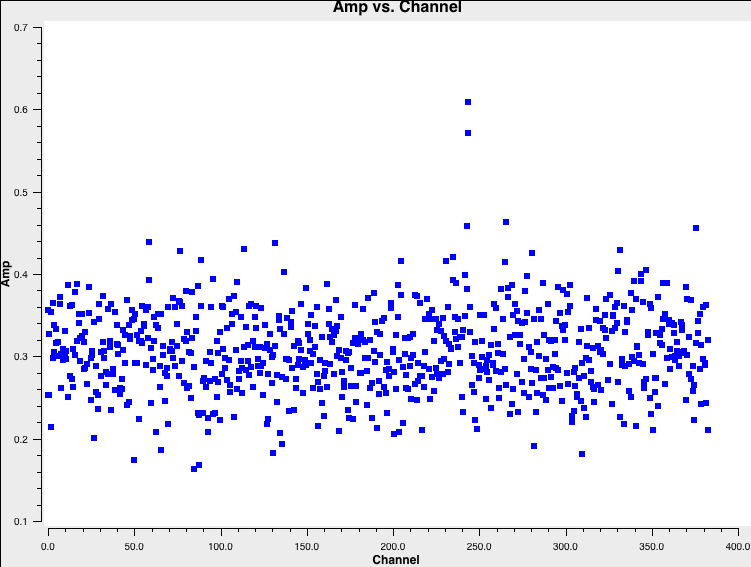
View amplitude vs. channel:
plotms(vis='twhya_selfcal.ms',
       xaxis='channel',
       yaxis='amp',
       field='5',
       avgspw=False,
       avgtime='1e9',
       avgscan=True,
       avgbaseline=True,
       showgui = True)
Save resulting plot as png file directly:
plotms(vis='twhya_selfcal.ms',
       xaxis='channel',
       yaxis='amp',
       field='5',
       avgspw=False,
       avgtime='1e9',
       avgscan=True,
       avgbaseline=True,
       showgui=False,
       plotfile='twhya_selfcal.ms_amp-vs-channel.png')
Perform continuum subtraction#
os.system('rm -rf twhya_selfcal.ms.contsub')
Perform the continuum subtraction:
uvcontsub(vis = 'twhya_selfcal.ms',
          field = '5',
          fitspec = '0:0~239;281~383',
          fitorder = 0,
          outputvis='twhya_selfcal.ms.contsub')
Inspect the continuum-subtracted data#
listobs(vis='twhya_selfcal.ms.contsub',
        listfile='twhya_selfcal_contsub_listobs.txt')
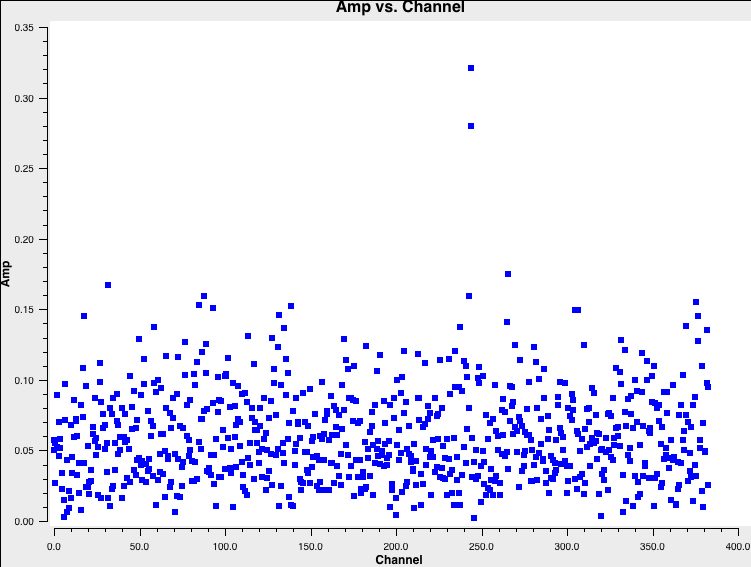
View amplitude vs. channel again:
plotms(vis='twhya_selfcal.ms.contsub',
       xaxis='channel',
       yaxis='amp',
       field='5', # TW Hya
       avgspw=False,
       avgtime='1e9',
       avgscan=True,
       avgbaseline=True,
       showgui = True)
Save resulting plot as png file directly:
plotms(vis='twhya_selfcal.ms.contsub',
       xaxis='channel',
       yaxis='amp',
       field='5',
       avgspw=False,
       avgtime='1e9',
       avgscan=True,
       avgbaseline=True,
       showgui=False,
       plotfile='twhya_selfcal.ms.contsub_amp-vs-channel.png')
Image the science target#
Set the rest frequency of the N2H+ molecular transition we are imaging:
restfreq = '372.67249GHz' # N2H+ rest frequency https://splatalogue.online/#/basic
To auto-mask and image non-interactively:
os.system('rm -rf twhya_n2hp.*')
tclean(vis='twhya_selfcal.ms.contsub',
       imagename='twhya_n2hp',
       field='5',
       spw='0',
       specmode='cube',
       perchanweightdensity=True,
       nchan=15,
       start='0.0km/s',
       width='0.5km/s',
       outframe='LSRK',
       restfreq=restfreq,
       deconvolver= 'hogbom',
       gridder='standard',
       imsize=[250, 250],
       cell='0.1arcsec',
       weighting='briggsbwtaper',
       robust=0.5,
       restoringbeam='common',
       niter=5000,
       interactive=False,
       nmajor = 1, # runs 1 major cycle and stops
       usemask='auto-multithresh', # Automasking parameters below this line
       noisethreshold=4.25,
       sidelobethreshold=2.0,
       lownoisethreshold=1.5,
       minbeamfrac=0.3,
       negativethreshold=15.0,
       verbose=True,
       fastnoise=False)
Perform primary beam correction#
os.system('rm -rf twhya_n2hp.pbcor.image')
impbcor(imagename='twhya_n2hp.image',
        pbimage='twhya_n2hp.pb',
        outfile='twhya_n2hp.pbcor.image')
Open & inspect resulting twhya_n2hp* files in CARTA!


